


 8 / 32

8
Community Council
Findings
REGIONAL ECONOMIC
TRENDS
Our study region includes Columbia and
Walla Walla counties and the Milton-
Freewater area. Economic growth in
our region has been slow over the
past decade, and employment rates
are uneven. Data from the Washington
state Employment Security Depart-
ment show that among all counties in
Washington state, Walla Walla County
had the least employment loss over
the past decade, but employment
growth has been much slower (0.4
percent compared to 2 percent in
Washington state), wage loss has been
greater and postrecession wage recov-
ery has lagged. Columbia County has
an aging population (47 percent are
50 years and older), and a low unem-
ployment rate (5.2 percent). Milton-
Freewater is a small town with slow
population growth and a high number
of seasonally employed workers. Its
unemployment rate is 19 percent, yet
15 new businesses opened in 2014,
and another 19 opened in just the first
six months of 2015.
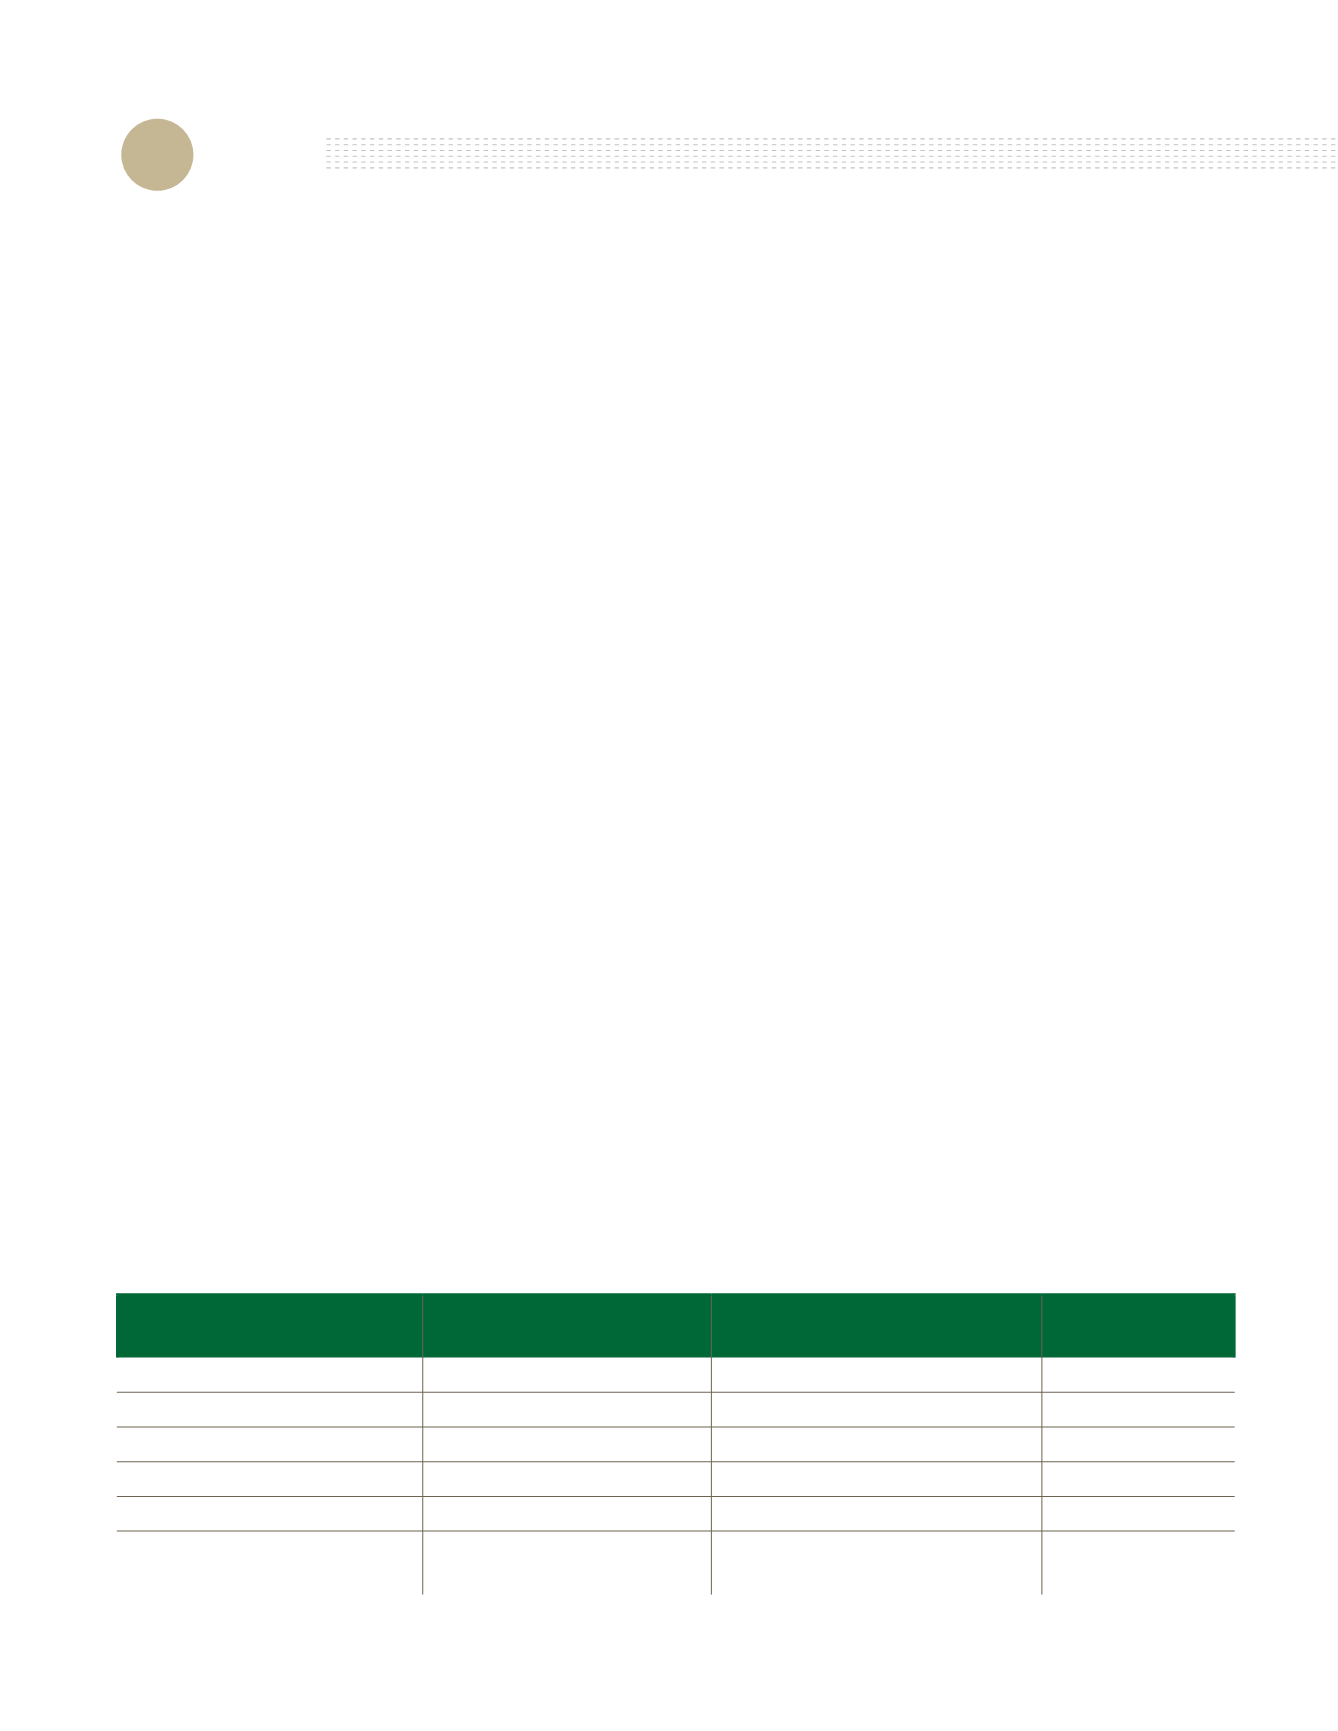
High-wage sectors
Some speakers encouraged invest-
ments in education that prepare
workers for sectors that employ large
numbers of workers and pay high
wages. The average annual wage
in Walla Walla County was $39,212
in 2014.
1
Average annual wages in
Walla Walla County are highest in
professional and technical services,
manufacturing, finance and insurance,
educational services, government, and
health care and social services. As the
table below illustrates, some of those
sectors have a relatively small pres-
ence in our economy. For example,
only 1.8 percent of Walla Walla Coun-
ty’s labor force is employed in profes-
sional and technical services and only
2.5 percent are employed in finance
and insurance. In our region, govern-
ment is the largest sector, employing
20 percent of Walla Walla County’s labor
force. Due to the relatively high wages
that sector pays, government accounts
for 25 percent of the county’s wages.
Health care and social services is the
second largest employment sector in
In this age of rapid
technological change,
our economic future is
profoundly uncertain—
we may not even be able
to imagine the kind of
jobs that will exist in
a few decades. In the
face of so much change
and unpredictability,
the ability to “learn how
to learn” is essential to
long-term employability.
Sector
Percent of total WallaWalla
County wages paid
Percent of WallaWalla County
labor force employed
Average annual
wage
Government
25
20
$48,453
Health care and social services
17.5
16.6
$41,270
Manufacturing
17.1
13
$52,009
Educational services
4.4
3.6
$48,705
Finance and insurance
3.2
2.5
$50,989
Professional and technical
services
2.6
1.8
$54,905
1
The average annual wage in the Walla Walla Metropolitan Statistical Area (WWMSA), which includes
Columbia and Walla Walla counties, was $39,070 in 2014.
HIGH-WAGE SECTORS
SHARE OF WAGES, SHARE OF EMPLOYMENT, AVERAGE ANNUAL WAGE
WALLA WALLA COUNTY, 2014*
*Washington State Employment Security, adapted from the Port of Walla Walla (2015).